Export of our Made in Italy is confirmed as the driving force of our economy. Representing about one third of the country’s GDP, every 1% of export growth translates into 0.3% growth in Italy’s overall GDP. In line with our strategy “Protection of Key Countries and Promotion of Emerging Countries”, a major push came from non-EU countries, where we have concentrated our institutional trips. Great performance of our export in the United States, from where we have just returned.
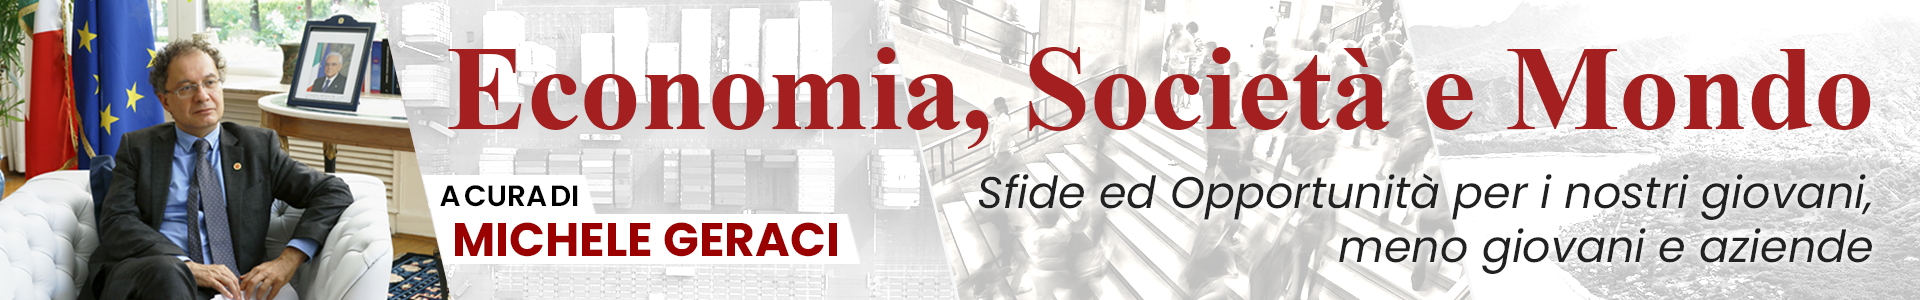
Figure 1: Italian Export growth rates by countries (May 2019 vs. May 2018)
May 2019 vs May 2018
- In May 2019, year-on-year export growth was + 8% while imports grew by + 3.4%. Exports had an excellent performance both in EU countries and outside the EU (with the sole exception being Turkey).
- In particular, among the EU countries, in May compared to the same month of 2018, exports grew in double figures in the Netherlands (19.8%) and in Belgium (17.3%)
- In non-EU countries, the most dynamic target markets were Japan (+ 22.8%), Switzerland (+ 21.4%) and the United States (+ 16%)
January-May 2019 vs January-May 2018
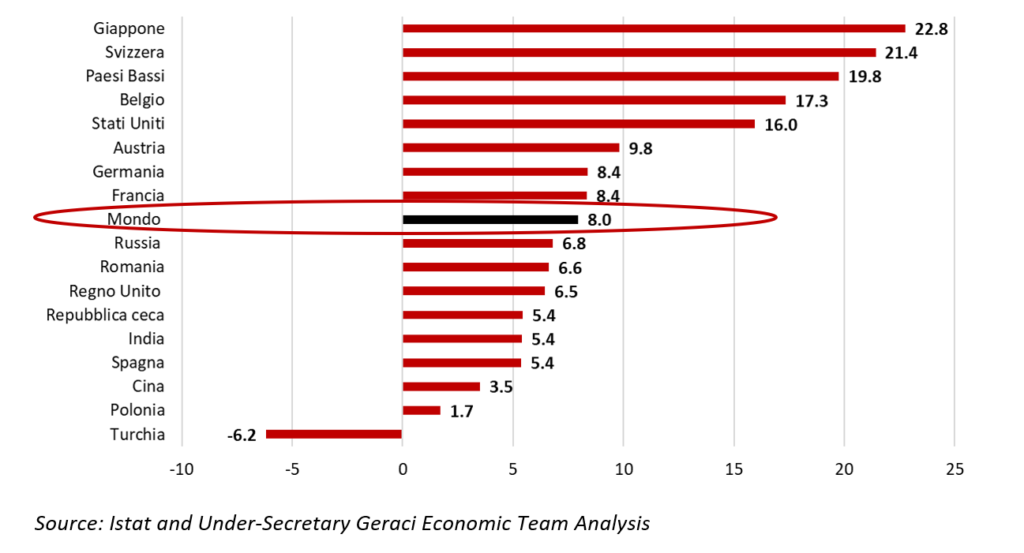
- Looking at the first 5 months of 2019, compared to the same period of the previous year, there was growth in both exports (+ 4.0%) and imports (+ 2.9%). The excellent performance of exports was driven by sales trends in non-EU countries.
- Among the EU countries the best performances of Italian exports were recorded in Belgium (+ 7.5%), the Netherlands (+ 4.9%) and Austria (+ 4.6%).
- Among the non-EU markets in the first 5 months of the year Italian sales grew most in Switzerland (18.6%), Japan (+ 15.1%) and the United States (+ 8.5%) and India (+ 7.9%).
- Japan, the United States and India have been the subject of as many as 6 of our foreign trips, two for each country, in line with out new “Core + Satellite” strategy that aims to consolidate our exports in traditional countries (EU and USA) and to seize opportunities in countries extra-EU, Asia in particular, where values are still low but growth rates are high
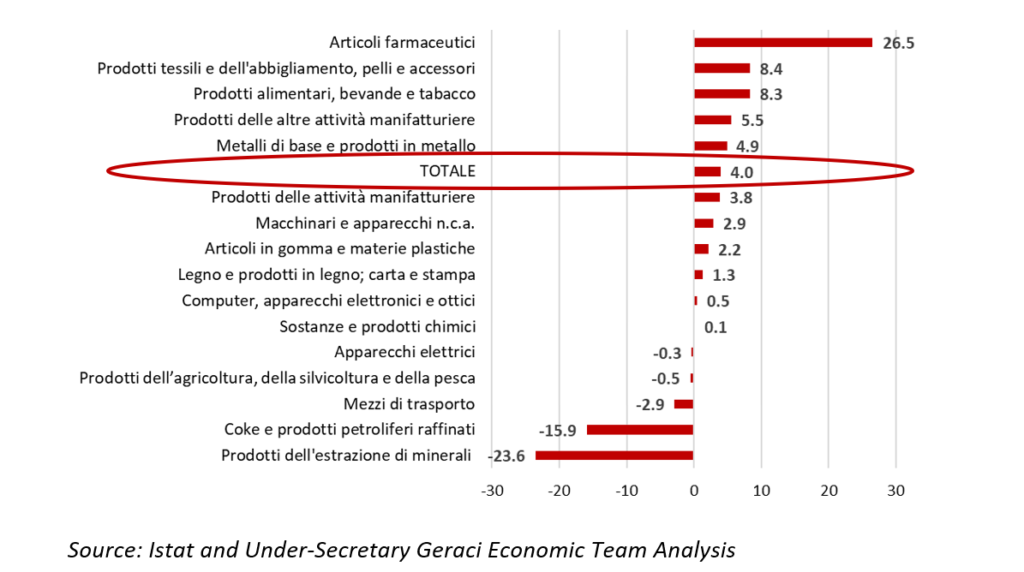
- In the first 5 months of 2019 (compared to the same period of the previous year) the most dynamic sectors on foreign markets were: pharmaceutical, chemical-medicinal and botanical items (+ 26.5%), the clothing articles sector (+ 8.4%) and food, drink and tobacco products (+ 8.3%).
Figure 2: Italian Export growth rates by countries (Jan-May 2019 vs. Jan-May 2018)
Figure 3: Italian Export growth rates by sectors (Jan-May 2019 vs. Jan-May 2018)