However they look, unfortunately the philosophical differences between those who have polluted and those who have to clean are many.
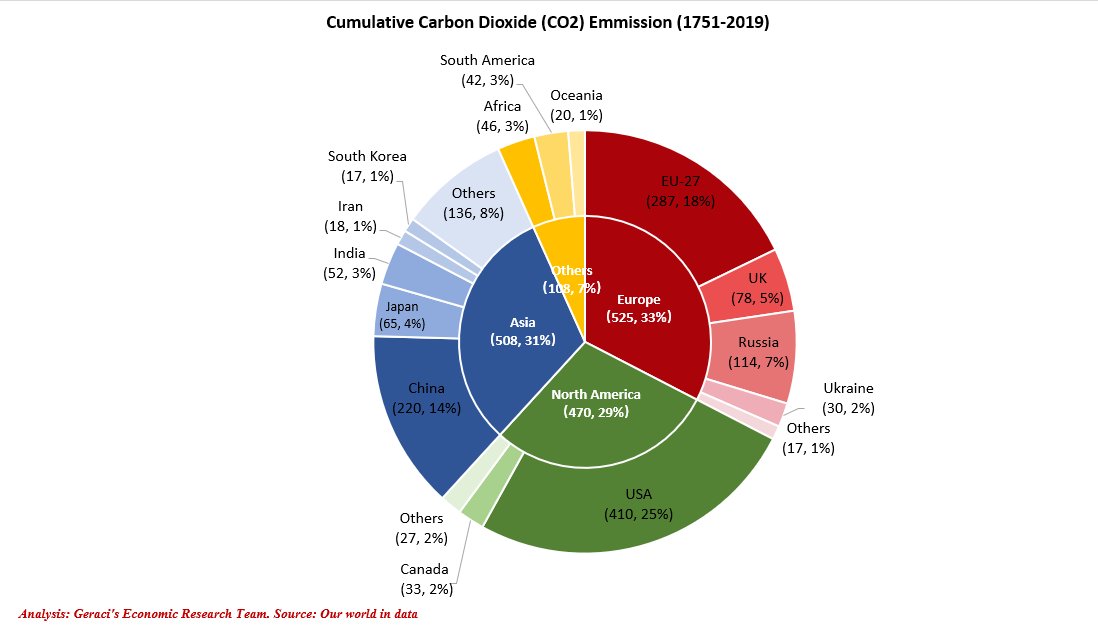
1) Cumulative Emissions 1751-2019
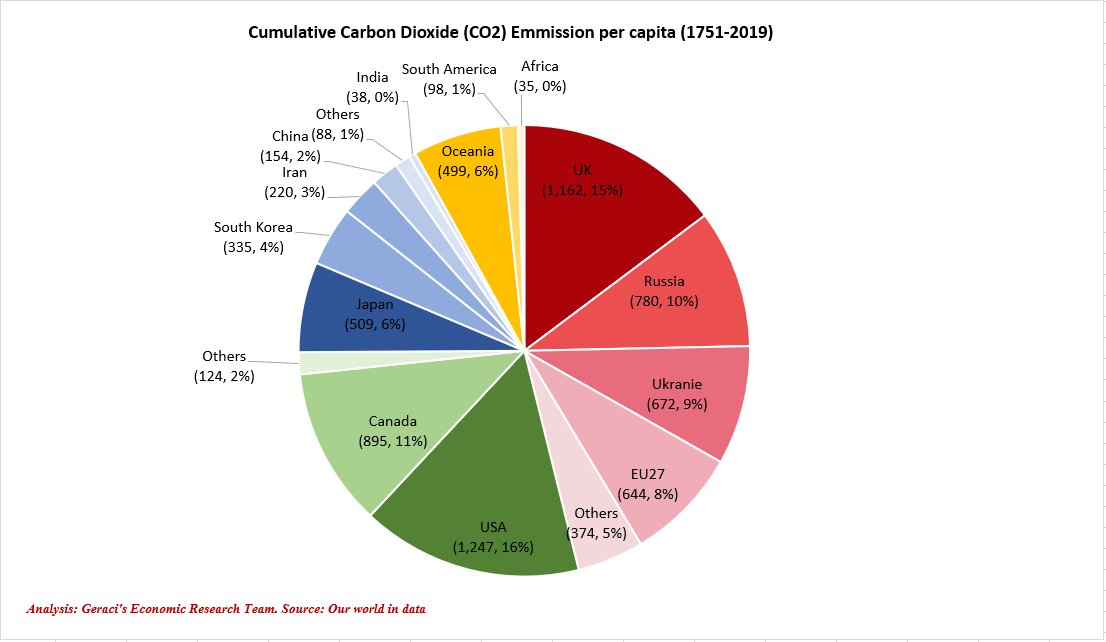
2) Per capita emissions 1751-2019
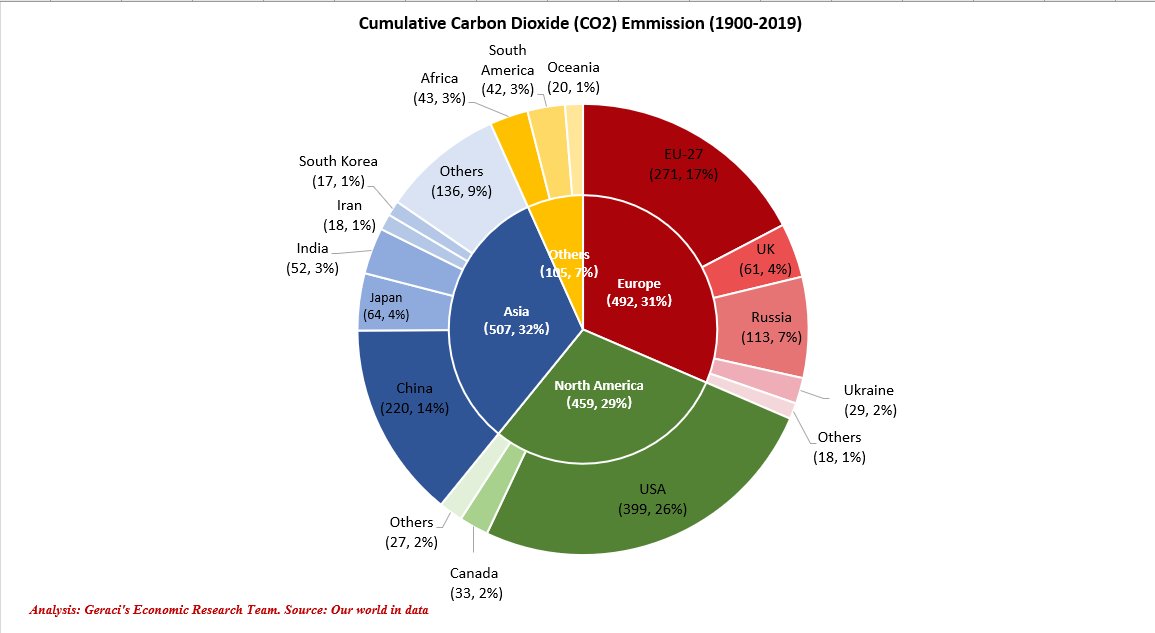
3) Cumulative Emissions 1900 – 2019
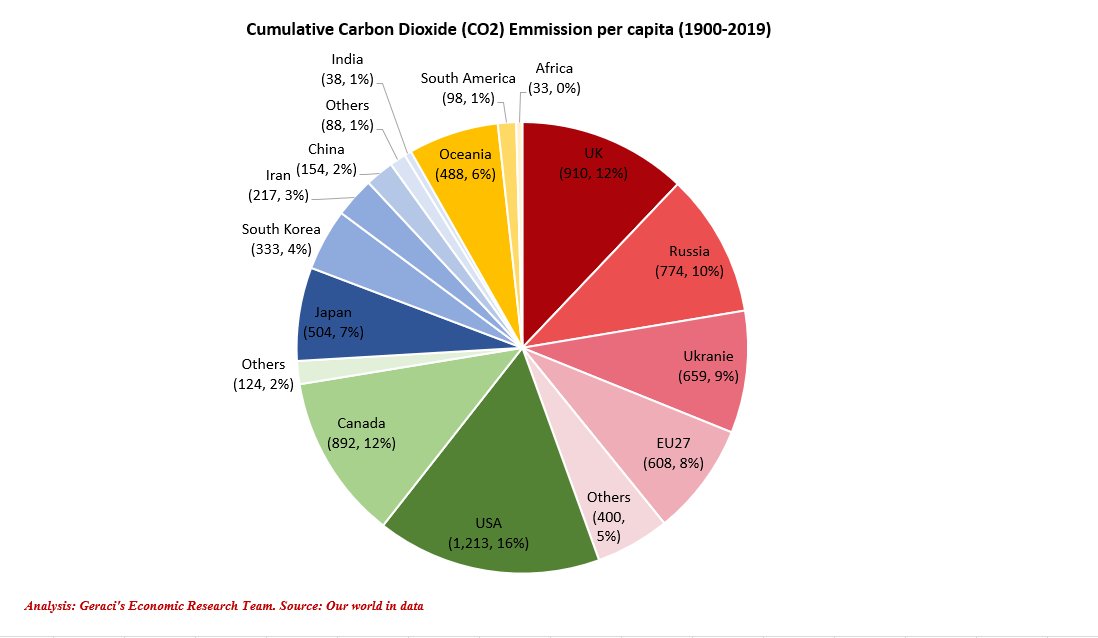
4) Per capita emissions 1900-2019
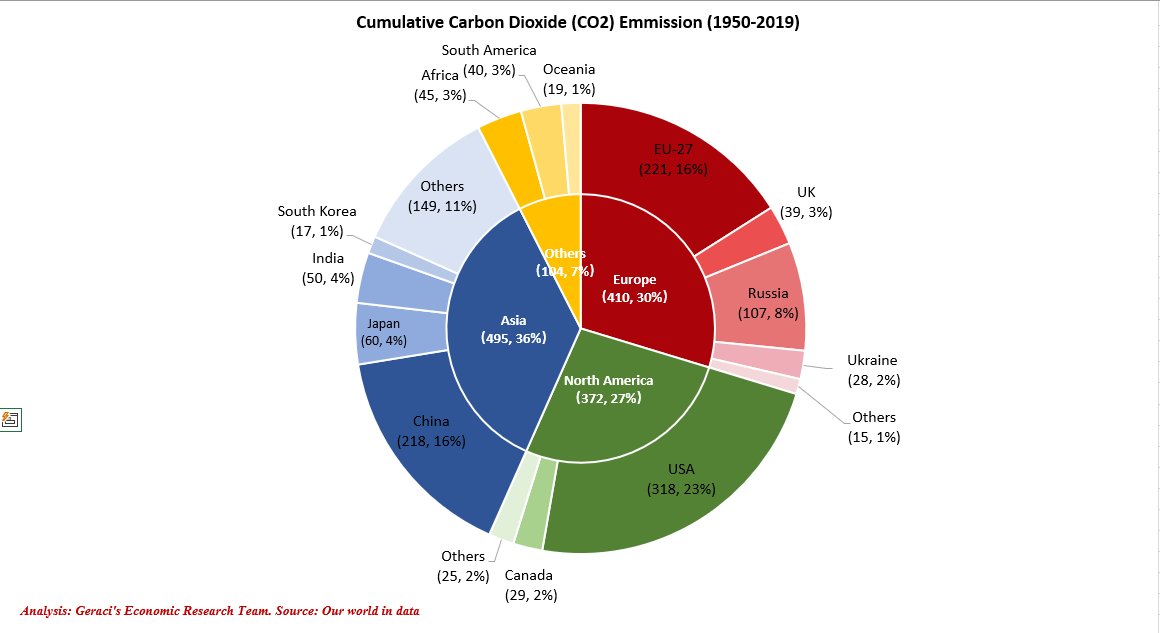
5) Cumulated Emissions 1950-2019
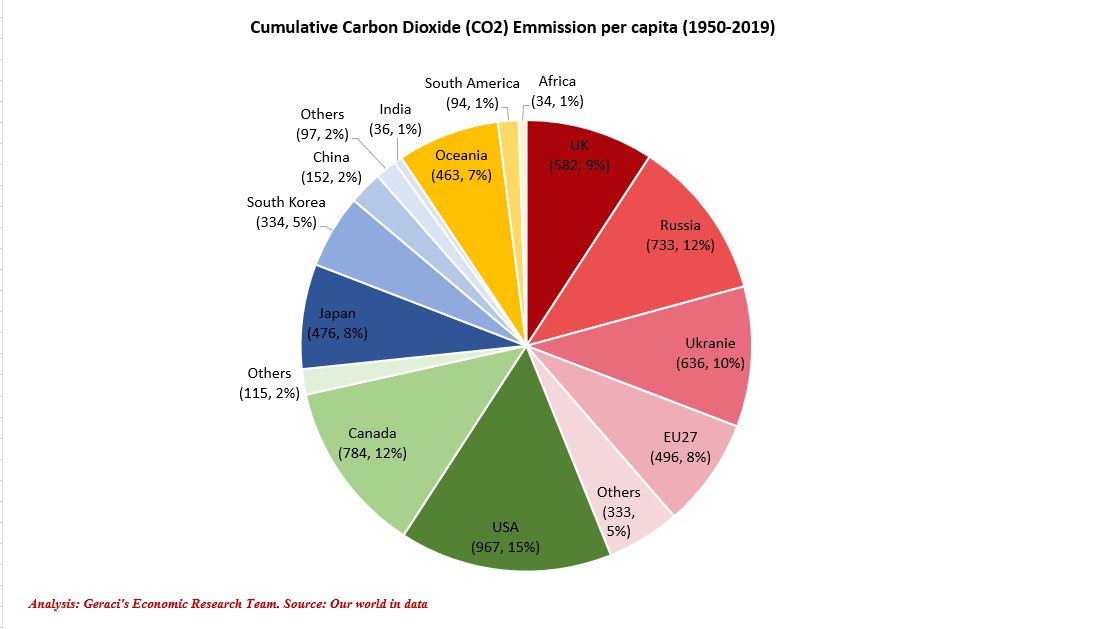
6) Per capita emissions 1950-2019
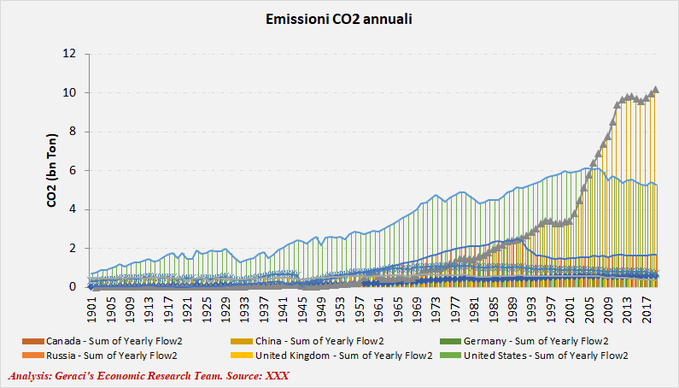
7) Annual (line) and full (cumulative) emissions