
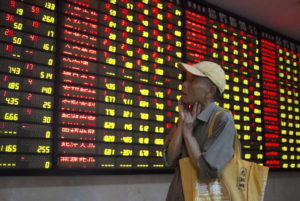
 La Cina cresce del 6.9%

Andiamo a scavare i motori di questa crescita, analizzando paragrafo per paragrafo il comunicato stampa dell’ufficio statistico. In questo approfondimento cerco di chiarire il significato di alcuni numeri, interpretare le dinamiche di crescita e, mi auguro, stimolare la curiosità con delle domande. Una sorta di seminario.
National Economy Maintained the Momentum of Stable and Sound Development and Exceeded the Expectation
National Bureau of Statistics of China
18 January 2018
In 2017, under the strong leadership of the CPC Central Committee with Comrade Xi Jinping as the core, all regions and departments implemented the decisions and arrangements made by the CPC Central Committee and the State Council, adhered to the general working guideline of making progress while maintaining stability, adopted the new development philosophy, focused on the supply-side structural reform and pushed forward structural optimization, shifting of driving forces and quality improvement. As a result, the national economy has maintained the momentum of stable and sound development and exceeded the expectation with the economic vitality, impetus and potential released and the stability, coordination and sustainability strengthened. The economy has achieved stable and healthy development.
According to the preliminary estimation, the gross domestic product (GDP) of China was 82,712.2 billion yuan in 2017, an increase of 6.9% at the constant price compared with last year. Specifically, the year-on-year growth of GDP for the first quarter was 6.9%, 6.9% for the second quarter, 6.8% for the third quarter, and 6.8% for the fourth quarter. The value added of the primary industry was 6,546.8 billion yuan, up by 3.9% over the previous year; that of the secondary industry was 33,462.3 billion yuan, up by 6.1%; and that of the tertiary industry was 42,703.2 billion yuan, up by 8.0%.
Crescita che supera le previsioni e la media del quinquennio del 6.5. La Cina non sbaglia quasi mai una previsione. C’è un chiaro piano industriale che viene eseguito nei minimi dettagli.
1. Agricultural Production Enjoyed Another Harvest and Production of Animal Husbandry Grew Stably.
The total grain output in 2017 was 617.91 million tons, an increase of 1.66 million tons compared with last year, up by 0.3%. The total output of summer grain was 140.31 million tons, up by 0.8%; the total output of early rice was 31.74 million tons, down by 3.2%; the total output of autumn grain was 445.85 million tons, up by 0.4%. The total output of cotton was 5.49 million tons, up by 2.7%. The total output of pork, beef, mutton and poultry was 84.31 million tons, up by 0.8 percent over last year, among which the total output of pork was 53.40 million tons, up by 0.8 percent; the beef 7.26 million tons, up by 1.3 percent; the mutton 4.68 million tons, up by 1.8 percent; the poultry 18.97 million tons, up by 0.5 percent. There were 433.25 million pigs registered, a year-on-year decrease of 0.4% and 688.61 million pigs slaughtered, a year-on-year increase of 0.5%.
Produzione di carne bovina 7.2 milioni di tonnellate, ma la domanda è di circa 8 milioni. Questo gap viene colmato con importazioni. Anche l’Italia finalmente nella lista dei paesi che possono esportare carne bovina in Cina. È una buona opportunità, vediamo se riusciamo a fare bene operativamente dopo che la macchina diplomatica ha fatto il suo risultato.
2. Industrial Production Grew Faster with Rising Profit for Enterprises.
The real growth of the total value added of the industrial enterprises above the designated size in 2017 was 6.6%, 0.6 percentage point faster than last year. An analysis by types of ownership showed that the value added of the state holding enterprises was up by 6.5 percent; that of the collective enterprises, up by 0.6 percent; share-holding enterprises, up by 6.6 percent; and enterprises funded by foreign investors or investors from Hong Kong, Macao and Taiwan, up by 6.9 percent. In terms of sectors, the value added of the mining dropped by 1.5%, the manufacturing increased by 7.2% and the electricity, thermal power, gas and the production and supply of water increased by 8.1%. The value added of the high-tech industry and equipment manufacturing increased by 13.4% and 11.3% year on year, 6.8 and 4.7 percentage points faster than that of the industries above the designated size. In 2017, the sales-output ratio of the industrial enterprises above the designated size reached 98.1%. The export delivery value of these enterprises reached 12,323.0 billion yuan, up by 10.7% over last year. In December, the total value added of the industrial enterprises above the designated size was up by 6.2% year-on-year or up by 0.52% month-on-month.
From January to November, the profits made by industrial enterprises above the designated size stood at 6,875.0 billion yuan, up by 21.9% year-on-year, 12.5 percentage points faster than the same period last year. The profit rate of the principal activities of the industrial enterprises above the designated size was 6.36%, up by 0.54 percentage point compared with the same period last year.
3. The Service Sector Maintained Fast Growth and the Business Activity Index Maintained within the Range of Expansion.
In 2017, the Index of Services Production increased by 8.2% over last year, 0.1 percentage point faster than last year. In December, the Index of Services Production increased by 7.9% year-on-year, 0.1 percentage point faster than last month. From January to November, the business revenue of service enterprises above the designated size increased by 13.9% year-on-year, 2.5 percentage points faster than the same period last year; the operating profit of service enterprises above the designated size increased by 30.4%, 28.2 percentage points faster; the business revenue of strategic emerging services, producer services and science and technology services increased by 18.0%, 15.0% and 15.1% year on year respectively.
In December, the Business Activity Index for services was 53.4%. Specifically, the Business Activity Index for sectors like postal services, telecommunication, broadcast, television and satellite transmission services, internet, software and information technology services, banking and insurance kept within the expansion range of 57.0% and above. From the perspective of market demand, the New Order Index for the service industry was 50.9%, maintaining within the expansion range for eight months in a row. From the perspective of market expectation, the Business Activities Expectation Index was 60.3%, maintaining within the expansion range for seven months in a row.
4. The Investment Structure Continued to Improve and the Floor Space of Commercial Buildings for Sale Decreased.
In 2017, the investment in fixed assets (hereinafter excluding rural households) was 63,168.4 billion yuan, growing by 7.2% over last year, 0.9 percentage point slower than last year. Specifically, the investment by the state holding enterprises reached 23,288.7 billion yuan, a rise of 10.1%; private investment reached 38,151.0 billion yuan, up by 6.0%, 2.8 percentage points faster than last year, accounting for 60.4% of the total investment.
Gli investimenti complessivi sono cresciuti del 7.2%, ma è importante notare che il contributo degli investimenti fatti dalle aziende di Stato è cresciuto di più, 10.1% a conferma che la Cina fa Sistema e le aziende di stato sono quelle che danno una spinta alla crescita. Da notare, tuttavia, che la definizione di “aziende di stato” e “aziende private” non è sempre chiara e lineare.
The investment in the primary industry was 2,089.2 billion yuan, up by 11.8%; the secondary industry 23,575.1 billion yuan, up by 3.2%, among which the investment in manufacturing was 19,361.6 billion yuan, an increase of 4.8%; and the tertiary industry 37,504.0 billion yuan, an increase of 9.5%, among which the investment in infrastructure was 14,000.5 billion yuan, up by 19.0%, 1.6 percentage points faster than last year.
Non solo la Cina cresce perché investe, ma perché investe in infrastrutture. Il modello di crescita cinese si basa sul principio di “Prima facciamo le infrastrutture e poi le utilizzeremo”. Nel 2017 un bel 19% di crescita che dovrebbe far comprendere l’importanza di questo settore. Volando su altro tema, è quello che la Cina sta facendo in Africa, esporta il proprio modello di sviluppo basato su infrastrutture, magari adattandolo alle esigenze dei paesi Africani. E questo principio è anche alla base della One Belt One Road, un grande progetto di infrastrutture in Asia.
The investment in the high-tech industry and equipment manufacturing went up by 17.0% and 8.6% year-on-year, 2.8 percentage points and 4.2 percentage points faster; the investment in energy-intensive manufacturing decreased by 1.8% compared with last year. The funds in place for investment in fixed assets in 2017 were 62,981.5 billion yuan, up by 4.8% compared with last year. The planned total investment in newly-started projects was 51,909.3 billion yuan, up by 6.2%. The year-on-year growth of investment in fixed assets from January to December was the same as that from January to November. In December, the investment in fixed assets grew by 0.53% month-on-month.
Guardando ai settori industriali, High-Tech e Manifatturiero crescono del 17% e del 8.6%, tassi di crescita più alti di quelli del 2016. Lo ripeto: non solo questi due settori crescono più del Pil, ma la crescita accelera, nonostante la dimensione aumenti anno dopo anno. Spero che quando parlo di Tsunami, i numeri cominciano a parlare anche loro.
D’altra parte, la spinta all’economia verde, sostenibile fa calare gli investimenti nei settori manifatturieri ad alta intensità energetica. Bingo. Tutto quadra.
The total investment in real estate development in 2017 was 10,979.9 billion yuan, an increase of 7.0%, 0.1 percentage point faster than last year, among which the investment in residential buildings went up by 9.4%. The floor space newly started was 1,786.54 million square meters, up by 7.0%. Specifically, the newly started floor space of residential buildings went up by 10.5%. The floor space of commercial buildings sold was 1,694.08 million square meters, up by 7.7%. Specifically, the floor space of residential buildings sold was up by 5.3%. The total sales of commercial buildings were 13,370.1 billion yuan, up by 13.7%, among which the sales of residential buildings were up by 11.3%. The land space purchased for real estate development was 255.08 million square meters, up by 15.8%. By the end of December, the floor space of commercial buildings for sale was 589.23 million square meters, down by 15.3% over the end of last year. The funds in place for real estate development enterprises reached 15,605.3 billion yuan, up by 8.2%.
5. Market Sales Witnessed Steady and Comparatively Fast Growth and Consumption Upgrade Showed Remarkable Momentum.
In 2017, the total retail sales of consumer goods reached 36,626.2 billion yuan, up by 10.2% over last year, 0.2 percentage point slower than last year. Specifically, the retail sales of consumer goods by enterprises above the designated size stood at 16,061.3 billion yuan, up by 8.1%. Analyzed by different areas, the retail sales in urban areas reached 31,429.0 billion yuan, up by 10.0%, and the retail sales in rural areas stood at 5,197.2 billion yuan, up by 11.8%. Grouped by consumption patterns, the income of catering industry was 3,964.4 billion yuan, up by 10.7%; and the retail sales of goods were 32,661.8 billion yuan, up by 10.2%. In particular, the retail sales of the enterprises above the designated size reached 15,086.1 billion yuan, up by 8.2%. The sales of upgraded consumer goods witnessed fast growth. Specifically, the sales of telecommunication equipment, sports and recreational articles and cosmetics increased by 11.7%, 15.6% and 13.5% respectively. In December, the growth of total retail sales of consumer goods was 9.4% year-on-year, or 0.7% month-on-month.
In 2017, the online retail sales reached 7,175.1 billion yuan, an increase of 32.2% compared with last year, 6.0 percentage points faster than last year, among which the retail sales of physical goods was 5,480.6 billion yuan, up by 28.0%, accounting for 15.0% of the total retail sales of consumer goods, or 2.4 percentage points higher than last year. The online retail sales of non-physical goods were 1,694.5 billion yuan, up by 48.1%.
Vendite online sono il 20% del totale vendite al dettagli, in crescita del 32% ed in accelerazione rispetto al 2016. Da notare, importante, è che la maggior parte di queste vendite online riguarda oggetti fisici, il che comporta, alle spalle, una rete logistica di distribuzione che, credo, non ha uguali al mondo. Sapete quanti pacchi sono stati spediti l’11 Novembre, giorni della promozione “doppio Single day”?
6. The Import and Export Further Increased and the Trade Structure Continued to Optimize.
The total value of imports and exports in 2017 was 27,792.1 billion yuan, up by 14.2% over last year, putting an end to the continuous decrease in the past two years. The total value of exports was 15,331.8 billion yuan, up by 10.8%; the total value of imports was 12,460.3 billion yuan, up by 18.7%. The trade balance was 2,871.6 billion yuan in surplus. The value of general trade increased by 16.8%, accounting for 56.4% of the total value of imports and exports, 1.3 percentage points higher than last year. The export of electrical and mechanical products increased by 12.1%, accounting for 58.4% of the total value of imports and exports, 0.7 percentage point higher than last year. In December, the total value of imports and exports was 2,706.5 billion yuan, up by 4.5% year-on-year. Of this total, the value of exports was 1,534.2 billion yuan, up by 7.4%; and the value of imports was 1,172.2 billion yuan, up by 0.9%.
Importazioni crescono più delle esportazioni, con un risultante compressione del surplus commerciale che resta di 2,800 miliardi di RMB, cioè 430 miliardi di dollari (calcolo approssimativo). Ma il surplus, attenzione conta il 3.3% del Pil (2800/84000). Quindi attenzione a ripetere sempre che l’economia Cinese dipende dalle esportazioni e che deve ri-bilanciarsi sui consumi. È solo la seconda parte della frase che è vera.
7. The Consumer Price Rose Mildly and the Producer Prices for Industrial Goods Shifted from Decrease to Increase.
In 2017, the consumer price went up by 1.6% over last year, 0.4 percentage point slower than last year. Specifically, the price went up by 1.7% in urban areas and up by 1.3% in rural areas. Grouped by commodity categories, prices for food, tobacco and liquor went down by 0.4%; clothing up by 1.3%; residence up by 2.6%; household facilities, articles and services up by 1.1 percent; transportation and communications up by 1.1 percent; education, culture and recreation up by 2.4%; healthcare and medical services up by 6.0%; and miscellaneous goods and services up by 2.4%. In terms of food, tobacco and liquor prices, grain went up by 1.5%, pork down by 8.8% and fresh vegetables down by 8.1%. In December, the consumer prices went up by 1.8% year-on-year, or up by 0.3% month-on-month. In 2017, the producer prices for industrial products went up by 6.3% compared with last year, putting an end to the 5-year decrease since 2012; the year-on-year growth in December was 4.9% and the month-on-month growth was 0.8%. In 2017, the purchasing prices for industrial producers were up by 8.1% over last year and in December, it was up by 5.9% year-on-year and up by 0.8% month-on-month.
8. The Growth of Resident Income Accelerated and the Income of Rural Residents Grew Faster than Urban Ones.
In 2017, the national per capita disposable income of residents was 25,974 yuan, a nominal growth of 9.0% over last year, or a real increase of 7.3% after deducting price factors, 1.0 percentage point faster than last year. In terms of permanent residence, the per capita disposable income of urban households was 36,396 yuan, a real growth of 6.5% after deducting price factors. The per capita disposable income of rural households was 13,432 yuan, up by 7.3% in real terms after deducting price factors. The per capita income of urban households was 2.71 times of the rural households, 0.01 less than last year. The median of the nationwide disposal income was 22,408 yuan, a nominal increase of 7.3%. Taking the per capita disposable income of nationwide households by income quintiles, that of the low-income group reached 5,958 yuan, the lower-middle-income group 13,843 yuan, the middle-income group 22,495 yuan, the upper-middle-income group 34,547 yuan, and the high-income group 64,934 yuan. In 2017, the national per capita consumption expenditure was 18,322 yuan, a nominal increase of 7.1%, or a real increase of 5.4% after deducting price factors. The number of rural migrant workers in 2017 totalled 286.52 million, which was 4.81 million more than last year, or up by 1.7%. Specifically, the numbers of local and outside migrant workers were 114.67 million and 171.85 million respectively, up by 2.0 and 1.5%. The average monthly income of migrant workers was 3,485 yuan, up by 6.4% over last year.
Importantissimo per chi fa business in Cina capire quanto mette in tasca il cinese medio. che non è il Pil pro capite. Il cinese medio mette in tasca 26,000 RMB all’anno, in crescita del 9%, e del 7.3% in termini reali. Quindi tenore di vita medio che cresce più del Pil. Qui faccio una piccola digressione: reddito personale e Pil possono avere dinamiche di crescita diverse e l’uno può essere più veloce dell’altro. Quindi attenzione, anche qualora la crescita del Pil si dovesse abbassare, non è detto che il tasso di crescita del reddito personale debba pure abbassarsi. Il governo cinese può ben tirare le fila di tutto il sistema economico e decidere di tenere, per esempio, penalizzare i profitti aziendali ma tenere alti i redditi personali, nel caso il Pil dovesse andar giù. Ha in mano la leva della re-distribuzione della ricchezza del paese. Da tener d’occhio per chi investe in borsa o per chi vende prodotti ai consumatori o alle aziende. Un bel puzzle.
Disparità di reddito. Qui entriamo in dinamiche un po’ complesse che necessiterebbero un discorso più ampio. Notiamo comunque che è il reddito delle zone rurali che cresce più velocemente, ed il divario di reddito urbano-rurale si restringe leggermente. Non trascuriamo le campagne, le zone rurali, dove il reddito cresce più velocemente. Né tantomeno trascuriamo le città di terza fascia (ricordate il mio video cast su Shanghai vs Kunming? Rivediamoli se vi va.
9. The Supply-Side Structural Reform was Further Pushed Forward and the Transformation and Upgrading Made New Achievements.
The efforts of cutting overcapacity, reducing inventory, deleveraging, lowering costs and strengthening weak areas were enhanced firmly. The industries of steel and coal have successfully fulfilled the annual task of cutting overcapacity. The national industrial capacity utilization rate reached 77.0%, the highest over the past five years. The inventories of commercial buildings continued to decrease, and at the end of December, the floor space of commercial buildings for sale was 106.16 million square meters less than that at the end of 2016. The leverage ratio of industrial enterprises continued to decrease. At the end of November, the asset-liability ratio of industrial enterprises above the designated size was 55.8%, 0.5 percentage point lower than the same period last year. The cost of enterprises continued to decrease. For the first eleven months, the cost for per-hundred-yuan turnover of principal activities of the industrial enterprises above the designated size was 85.26 yuan, 0.28 yuan less compared with the same period last year. Investment in weak areas grew rapidly. In 2017, investment in environmental protection and treatment of environmental pollution, management of water conservancy and agriculture went up by 23.9%, 16.4% and 16.4% over last year, or 16.7, 9.2 and 9.2 percentage points faster than the total investment.
The innovation-driven development continued to gain momentum and the new driving forces grew rapidly. In 2017, the number of newly registered enterprises nationwide was 6.074 million, up by 9.9% over last year, an average of 16.6 thousand each day. A number of major achievements were scored in science and technology, such as aerospace, artificial intelligence, deep sea exploration and biological medicine. New industries and products were booming.
Innovazione: Numeri cha ci fanno rabbrividire. Il numero delle nuove imprese è cresciuto di 6 milioni, 16 mila nuove aziende al giorno in più. Economia pianificata.
The value added of industrial strategic emerging industries grew by 11.0% compared with last year, 4.4 percentage points faster than the industries above the designated size; the production of industrial robots grew by 68.1% compared with last year, and that of new energy vehicles by 51.1%. The economic structure continued to be optimized. In 2017, the contribution of the value added of the tertiary industry to GDP accounted for 58.8%, 1.3 percentage points higher than last year. Consumption became the major driving force for green economic growth. The contribution of the final consumption expenditure to GDP accounted for 58.8%, 26.7 percentage points higher than the gross capital formation. Green development was solidly promoted. The energy consumption per 10,000 yuan worth of GDP went down by 3.7% over last year.
Produzione di veicoli ibridi cresce del 51%. Credo (da verificare) 700,000 nuovi veicoli ibridi nel 2017. Obiettivo 5 milioni tra qualche anno.
10. Population Increased Steadily with Continuous Increase of Urbanization Rate
By the end of 2017, the total population of mainland China was 1,390.08 million (including the population of 31 provinces, autonomous regions and municipalities, and servicemen in CPLA; but not including residents in Hong Kong SAR, Macao SAR and Taiwan Province and overseas Chinese), an increase of 7.37 million over that at the end of 2016. In 2017, the number of births was 17.23 million and the birth rate was 12.43 in a thousand; the number of deaths was 9.86 million with a death rate of 7.11 in a thousand; the natural growth rate was 5.32 in a thousand. In terms of gender, the male population was 711.37 million, and female population was 678.71 million; the sex ratio of the total population was 104.81 (the female is 100). A population at the working age of 16-59 was 901.99 million, accounting for 64.9% of the total population; population aged 60 and over was 240.90 million, which was 17.3% of the total population; population aged 65 and over was 158.31 million, accounting for 11.4% of the total population. In terms of urban-rural structure, the usual residents in urban areas were 813.47 million, an increase of 20.49 million over the end of last year; and the usual residents in rural areas were 576.61 million, a decrease of 13.12 million. The proportion of the urban population to the total population (urbanization rate) was 58.52%, 1.17 percentage points higher than that at the end of 2016. The population who reside in areas other than their household registration and have been away from there for over 6 months reached 291 million, which was 0.98 million less than last year. Specifically, the floating population was 244 million, or 0.82 million less than that at the end of 2016. At the end of 2017, the total number of employed persons was 776.40 million and the number of urban employed persons was 424.62 million.
Generally speaking, in 2017 the national economy has maintained the momentum of stable and sound development and exceeded the expectation with firm steps taken to secure a decisive victory in building a moderately prosperous society in all respects. We should also be aware that there are still difficulties and challenges confronting the economy and the improvement of quality and efficiency remains a daunting task. At the next stage, we should rally closer around the CPC Central Committee headed by Xi Jinping as the core, take Xi Jinping Thought on Socialism with Chinese Characteristics for a New Era as the guideline, deeply implement the spirit of the 19th National Congress of the Communist Party of China and the Central Economic Working Conference, adhere to the general working guideline of making progress while maintaining stability, stick to the new development philosophy and grasp the evolution of the principal contradiction facing Chinese society. We should comply with the requirements for high quality development, promote balanced economic, political, cultural, social and ecological progress, coordinate the implementation of the four-pronged comprehensive strategy, deepen the supply-side structural reform, coordinate the efforts in stabilizing growth, stimulating reform, adjusting structure, benefiting people’s livelihood and fending off risks, take tough steps to forestall and defuse major risks, carry out targeted poverty alleviation and prevent and control pollution, and promote sustained and sound development of the economy and society.
Notes:
1. The growth rate of gross domestic product, value added of the industrial enterprises above the designated size and its sub-items are real growth by using comparable prices. The growth rates of other indicators are nominal growth by using current prices unless otherwise specified.
2. According to the auto-revision function of the seasonal adjustment model, GDP in each quarter and the month-on-month changes of the value added of industrial enterprises above designated size, investment in fixed assets (excluding rural households), and total retail sales of consumer goods have been revised. The revised figures and figure for the fourth quarter GDP in 2017, as well as the month-on-month changes for other indicators in December 2017, are as follows:
The quarter-on-quarter growth of GDP in 2016 and 2017 was 1.3%, 1.9%, 1.8%, 1.7%, 1.4%, 1.9%, 1.8% and 1.6% respectively.
3. Industrial enterprises above the designated size are industrial enterprises with annual revenue from principal activities over 20 million yuan.
4. To reflect timely the monthly performance of economic activities in services sectors, the National Bureau of Statistics of China compiled the Index of Services Production and disseminated the information since March 2017. The Index of Services Production reflected the output changes between reporting period and base period after excluding price factors.
5. Units above the designated size in total retail sales of consumer goods include wholesale enterprises, retail enterprises and lodging and catering enterprises with annual revenue from the principal business over 20 million yuan, 5 million yuan and 2 million yuan respectively.
Online retail sales refer to the total retail sales of goods and services realized through internet trading platforms (including self-built websites and third-party platforms). Goods and services include physical goods and non-physical goods (e.g. virtual goods and services etc.).
The total retail sales of consumer goods include the online retail sales of physical goods, but not the non-physical goods.
6. The median of per capita income of urban and rural households refer to the per capita income of household lied in the middle of all surveyed households which are ranked from low to high based on per capita income level.
The income of urban and rural households by quintiles refer to the per capita income of surveyed households which are divided into five levels averagely, ranking from low to high based on per capita income level; the top 20% households with the highest income are classified as the high-income group. The other four levels are the upper-middle-income group, middle-income group, lower-middle-income group and low-income group.
7. Migrant workers refer to those who work in urban areas, or in the non-agriculture sectors in local or other areas for 6 months and above with their permanent household registrations being in rural areas. Local migrant workers refer to those who work in the administration area where they register their households permanently. Outside migrant workers refer to those who work in areas other than the administration area where they register their households permanently.
8. Floating population refers to the population who live in places other than their household registration excluding those with current residence different from the place of their household registration but still in the same city. The population who live in places other than their household registration but still in the same city refer to those whose current residences are different from the registered towns or streets in the same district or in different districts but still in the same municipality or prefecture-level city.
9. Employed persons refer to persons aged 16 and over who have the ability to work and engage in gainful employment for remuneration payment or business income.
10. Data of imports and exports are from the General Administration of Customs.
11. Due to the rounding-off reasons, the subentries may not add up to the aggregate totals.
In case of any differences between the English translation and the original Chinese text, the Chinese edition shall prevail.
Altro elemento che a mio avviso è molto importante è la disparità di reddito tra impiegato qualificato e operaio che può arrivare anche a 10 volte ma che si sta comunque assottigliando. Ciò rende facilmente e convenientemente possibili molti investimenti e grandi costruzioni da parte del ceto medio alto, avendo a disposizione un basso costo di manovalanza. Inoltre ciò contribuisce a dare socialmente un vero valore ai titoli di studio e professioni, cosa che ormai in Europa è piuttosto livellata, sminuendo di fatto l’ambizione ad perseguire master o dottorati.
Hey there! I just wish to offer you a big thumbs up for your great info you have here on this post.
I’ll be returning to your website for more soon.